Warming Stripes
Update for 2023
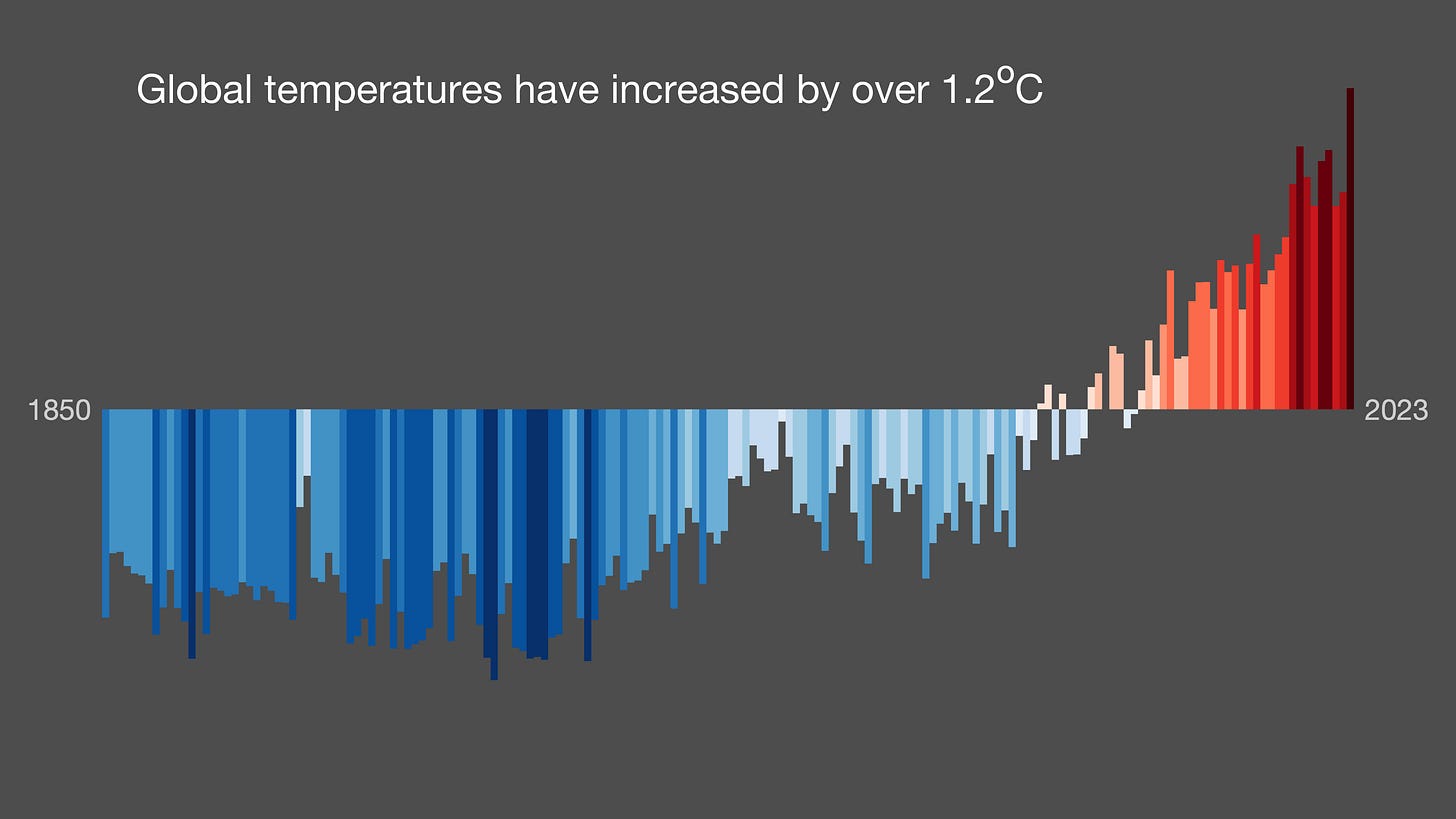
The iconic ‘warming stripes’ - a set of simple graphics that represent observed changes in temperature across the globe using coloured stripes - have been updated to include data for 2023.
It was globally the hottest year on record. By a large margin.
New for 2023
For the 2023 update to the graphics, we have done more than just add another stripe. There have been some subtle changes to the design of the graphics.
New colours have been added - a darker blue and a darker red have been added at each end of the colour scale.
The reference period used to define where blues change to reds has been changed - it is now 1961-2010 rather than 1971-2000.
The scales have been changed - for the global mean, the colours represent -0.9 to +0.9°C, and for the various regions & cities, we use -3 to +3σ (standard deviations) of the variations from 1901-2000.
The reason is that 2023 was such an extreme. This combination of changes better represents the larger range of temperatures now observed while maintaining as similar as possible look to the previous versions.
Importantly, Berkeley Earth have not yet provided the regional data needed so we have used the ERA5-Land dataset to extend the graphics for 2023, ensuring that the different datasets are matched appropriately using an overlapping period. We hope to switch back to using Berkeley Earth in due course.
Also - on the #ShowYourStripes website we now include an interactive map allowing anyone to pick their nearest city and view the simple stripes. Clicking on the graphic will show the complete set of graphics for that city.
There are still four different graphic designs to choose from for each location, each showing more details than the last. Which version is most appropriate may depend on the audience.
We also include a ‘showcase’ of many examples of the creative ways the stripes have already been used to start climate conversations across the world.
Which is your favourite?


Thanks for the update and providing such a simple and elegant visualization tool!
Where can I learn more about the methodolgy used to create the stripes. I do not fully understand it from the description above. Thank you!