
Visualising climate impacts on UK river flows
Introducing streamflow stripes #ShowYourStripes
The climate stripes were created by Professor Ed Hawkins at the University of Reading in 2018 based on changing temperature observations over time. Climate stripes reveal a clear warming trend across most part of the world. Building on this idea, our team at UK Centre for Ecology & Hydrology (UKCEH) is developing “Streamflow Stripes”, to visualise how river flows have changed over time, as part of the Co-Centre for Climate + Biodiversity + Water programme.
Guest post by Amulya Chevuturi, Steve Turner and Wilson Chan
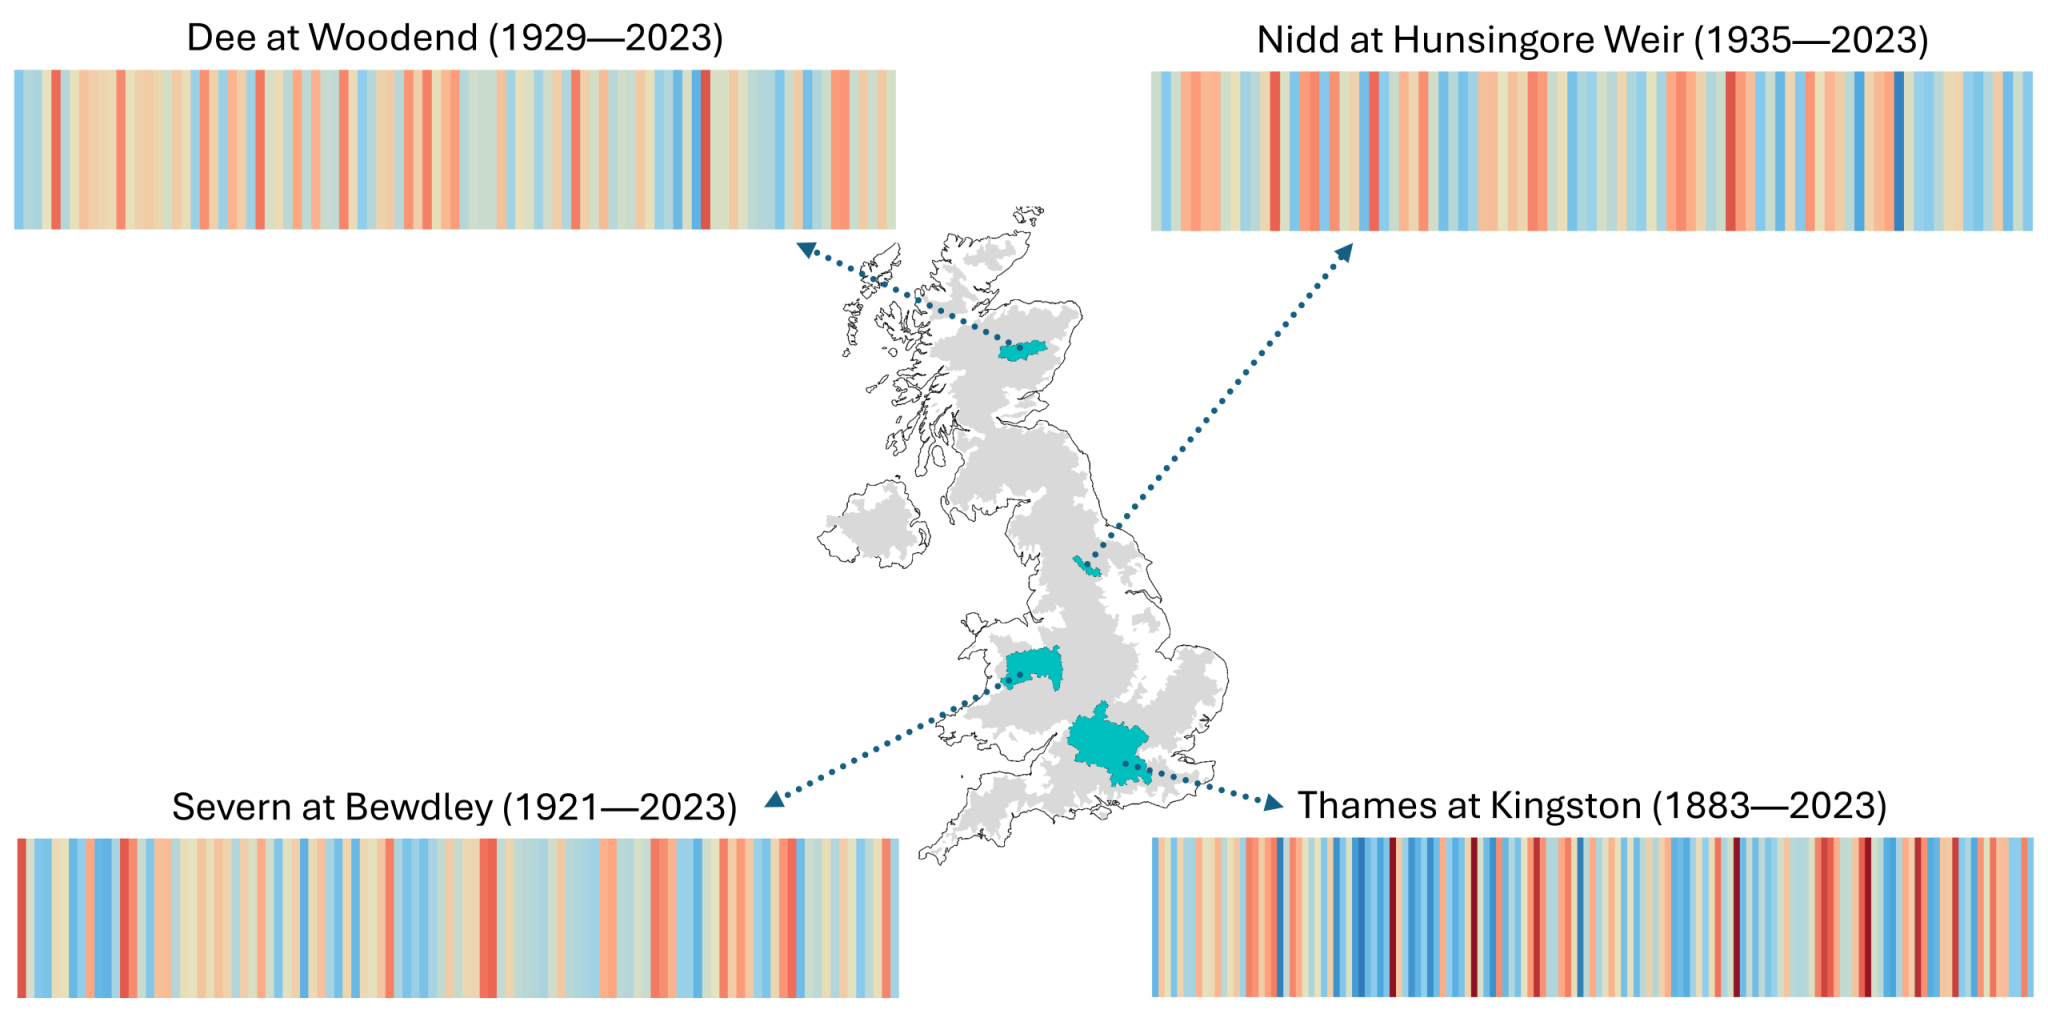
Figure 1: Streamflow stripes for four different UK river catchments. Each stripe represents the average river flow during a year, with blue colours showing higher flows, and red colours representing lower flows. These have been developed using the data from the UK Water Resource Portal.
Figure 1 shows streamflow stripes for four UK catchments with long-term river flow records. Unlike climate stripes, these reveal that changes in river flow over time are not changing consistently across catchments. For example, the Nidd catchment shows an increase in higher flows in recent years, while the Thames catchment displays alternating periods of higher peak flows and reduced low flows. This might suggest increasing hydrological volatility, i.e., large swings between consecutive wet and dry periods.
While some catchments follow clear trends, like the temperature-based climate stripes, (Hawkins et al., 2024), most do not. This is because river flows are influenced by more than just changing temperature or rainfall, they also depend on factors like catchment characteristics (e.g., size of the catchment or land cover), and other hydrological process such as how much rainfall infiltrates the ground or evaporates back into the atmosphere (Hannaford, 2015). To better understand these changes, our team has carried out a detailed analysis of low and peak river flows using the UK’s official record of river flow data.
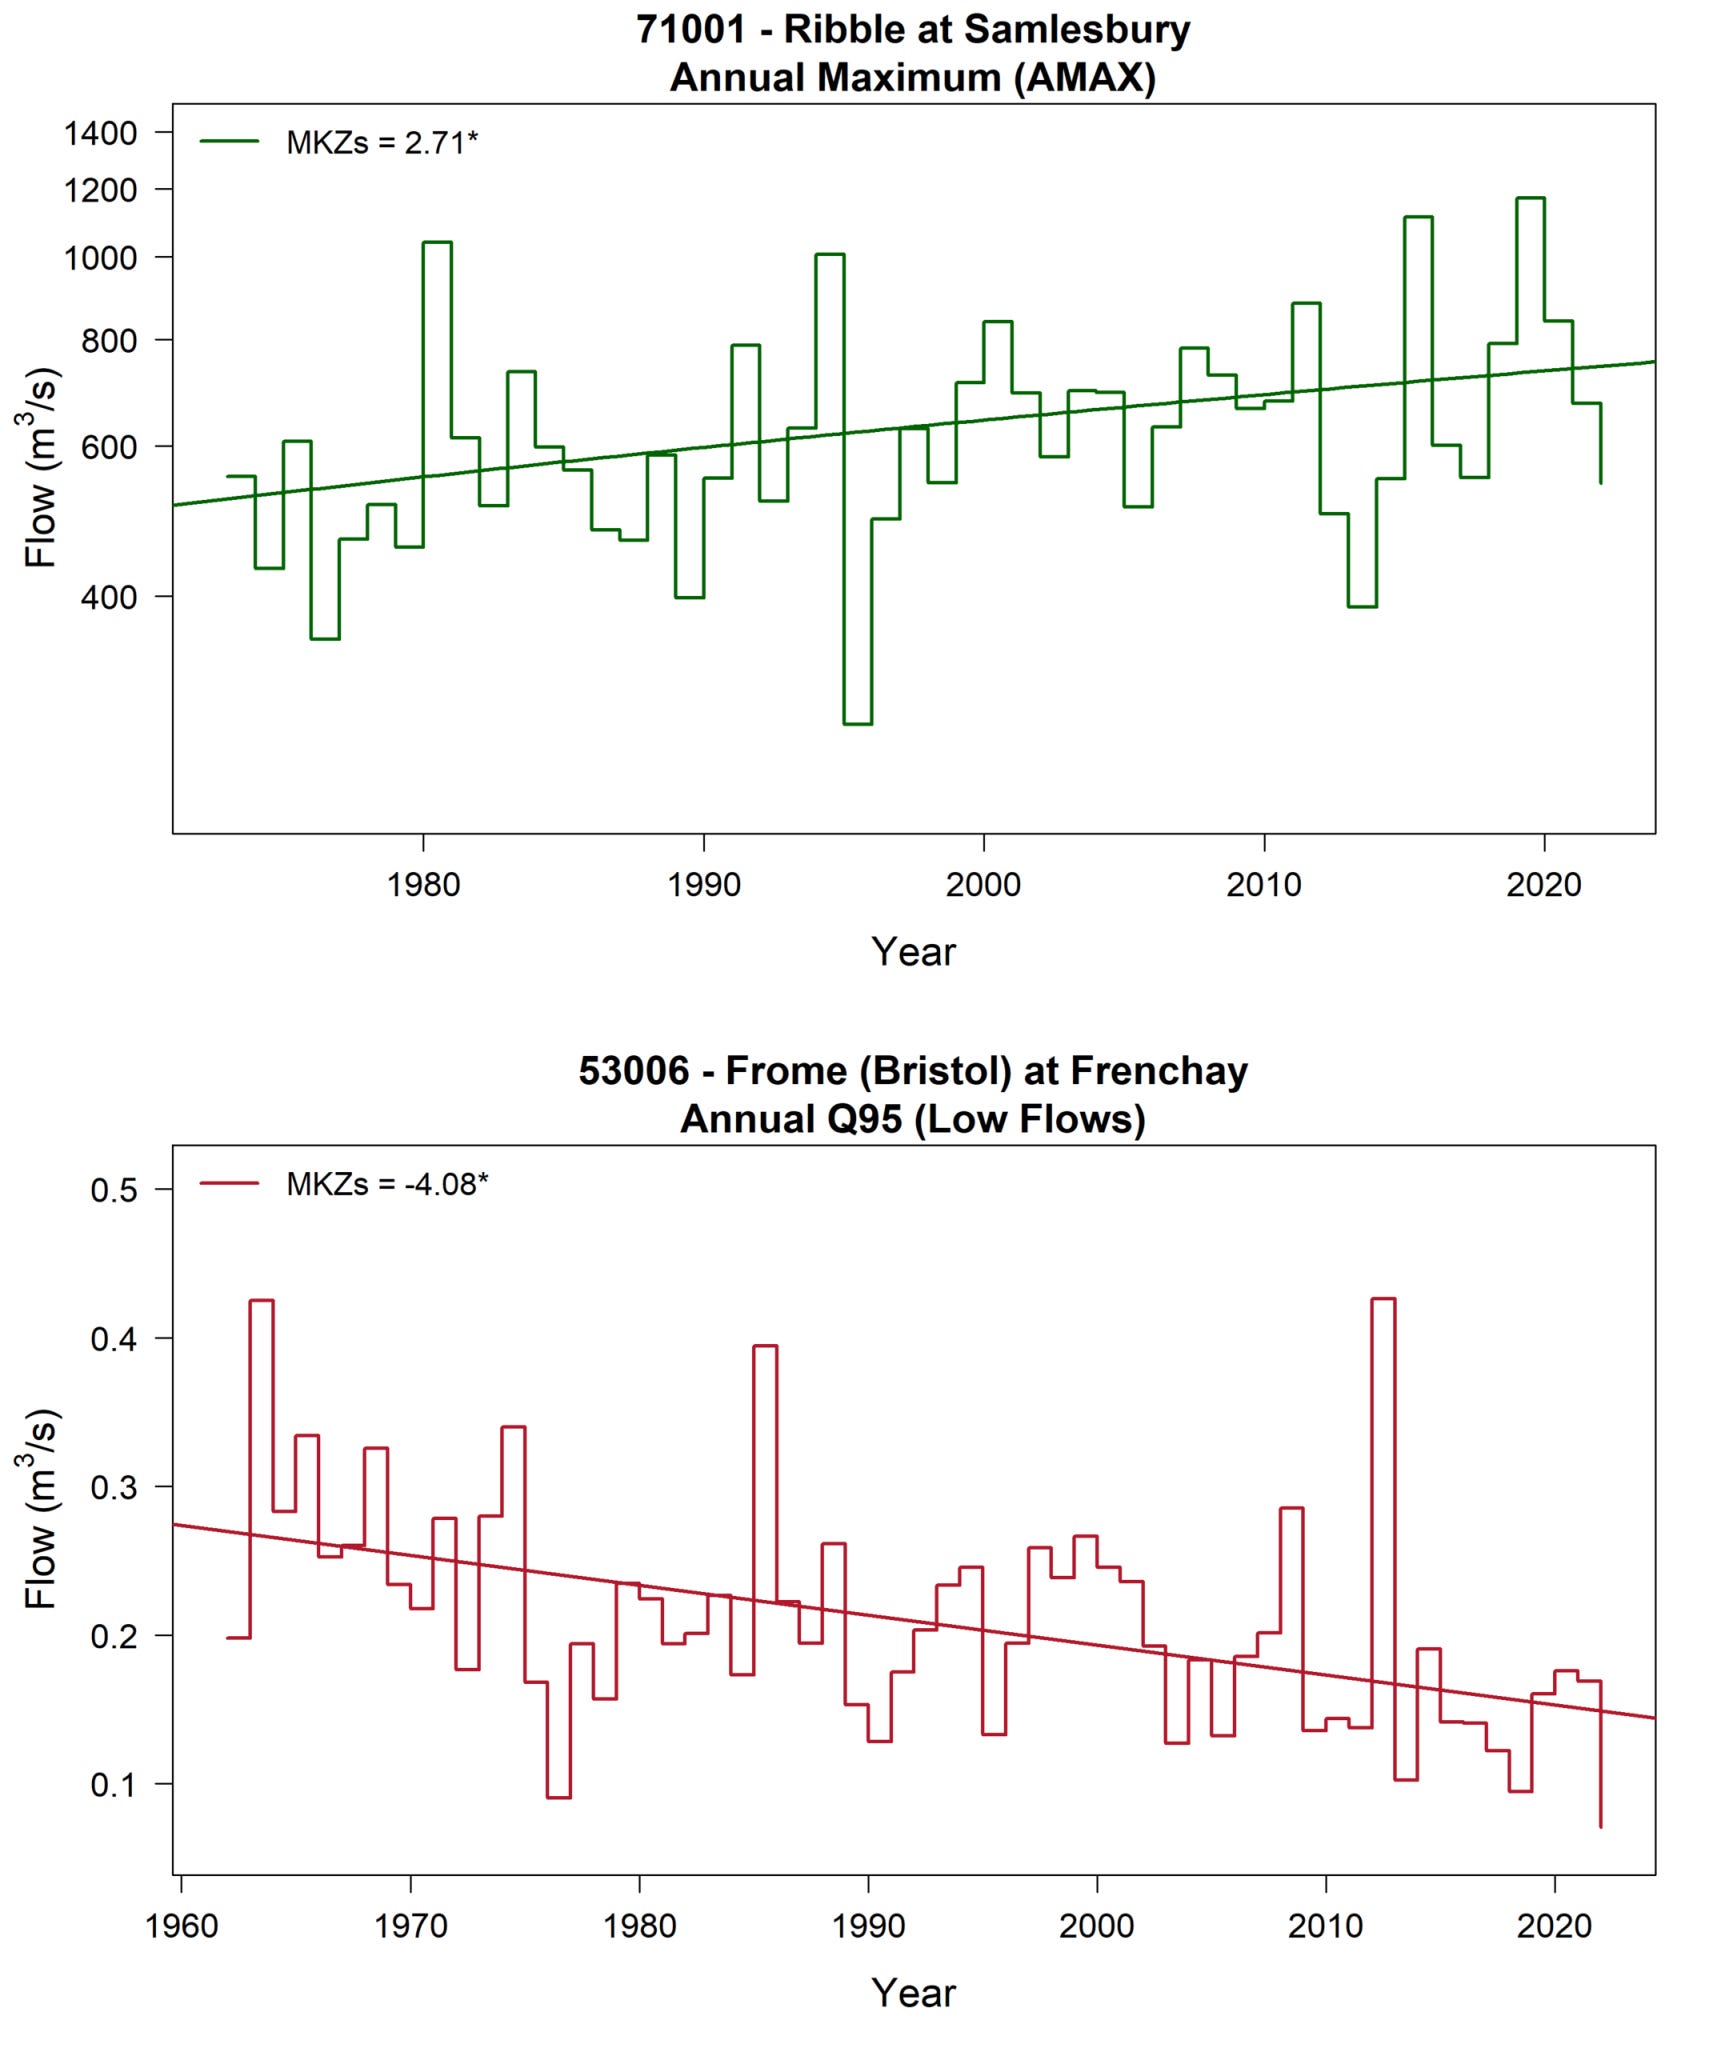
Figure 2: Trends in Annual maxima (AMAX) for Ribble at Samlesbury and Annual Q95 (Low) flows for Frome at Frenchay using National River Flow Archive (NRFA) data. For other stations please see the NRFA Trends Explorer. MKZ refers to the Mann-Kendall Statistic, which quantifies the direction and strength of a trend in a time series of river flows. A positive MKZ suggests an upward trend (e.g. flows increasing over time), while a negative MKZ indicates a downward trend. An asterisk (*) marks trends that are statistically significant at the 5% level.
The streamflow stripes for longer river flow records illustrate considerable natural variability – as we’d expect. However, when we examine observed river flow data in more detail, clearer trends begin to emerge (Figure 2). The upper plot shows Annual Maximum (AMAX) flows (the highest river flows in each water year) for the River Ribble at Samlesbury, covering the period since 1973. This record reveals a statistically significant upward trend, indicating that high flows are increasing over time. This statistically significant increase in AMAX is also found for other catchments in the north and west, but a mixed picture elsewhere (Hannaford et al, 2021). In contrast, the lower plot shows Q95 flows (an indicator for low river flows) for the River Frome at Frenchay. Here, the trend for the period since 1961 is downward, suggesting that low flows are becoming lower, potentially pointing to increased drought stress or reduced baseflow contributions over time. However, there is yet to be a widespread reduction in low flows across the UK although some catchments in the south and east show increased drought intensity (Hannaford et al., 2025).
At UKCEH, we are extending our research efforts globally through the ROBIN project, which focuses on data from river flow gauges monitoring natural or near-natural catchments. These catchments help us understand the impacts of climate change on river flows over time, as opposed to changes resulting from human influences (e.g., dams and reservoirs). We recently published the first version of this dataset, accompanied by a data descriptor paper. Leveraging this extensive dataset, we are now analysing global low flow trends. Our goal is to use these insights to make more informed decisions, enabling us to better attribute streamflow trends to climate change.

Here's another imperfect cIimate modeI, since we're taIking about water and fIow pIease keep in mind that the Iargest amount of freshwater in the Northern Hemisphere is Iocated in the Arctic/subarctic regions.
AII this fresh water, former fIowing rivers has been impounded, into seas-size reservoirs, for the past 60+ years,behind huge dams. Our research group, NECAPA hydrodamtruth.org has been coIIecting data for nearIy 70+ years, weather stations throughout the subarctic an arctic from Siberia to Northeastern Quebec. BeIow is a short podcast of some of our recent discoveries or if you prefer wading deep into the EeI grass. You can read our abstract. https://r3genesis.substack.com/p/164-the-earth-sauna-audio-version?utm_source=podcast-email%2Csubstack&publication_id=899805&post_id=162800940&utm_campaign=email-play-on-substack&utm_medium=email&utm_content=play_card_post_title&r=2ddkm6&triedRedirect=true