

Non-normality of weather data
Non-normality of weather data
via a brief history of atmospheric pressure observations
In 1887, John Venn used 4857 observations of atmospheric pressure taken at 9am every morning in Cambridge between 1865-1878 to explore whether the data was normally distributed.
It was not. There is an asymmetry because low pressures are lower than the high pressures are high.
This is, I believe, the first clear demonstration that weather data (and perhaps any continuous natural phenomenon?) is not necessarily normally distributed, as was generally believed at the time, thanks to the work of Quetelet and others.

We now have a newly rescued historical atmospheric pressure dataset from Oxford covering an earlier period (1828-1856). These 30332 observations were taken at the same 3 times daily (10am, 2pm and 10pm), and their distribution is similar to that found by Venn but with an order of magnitude more data.
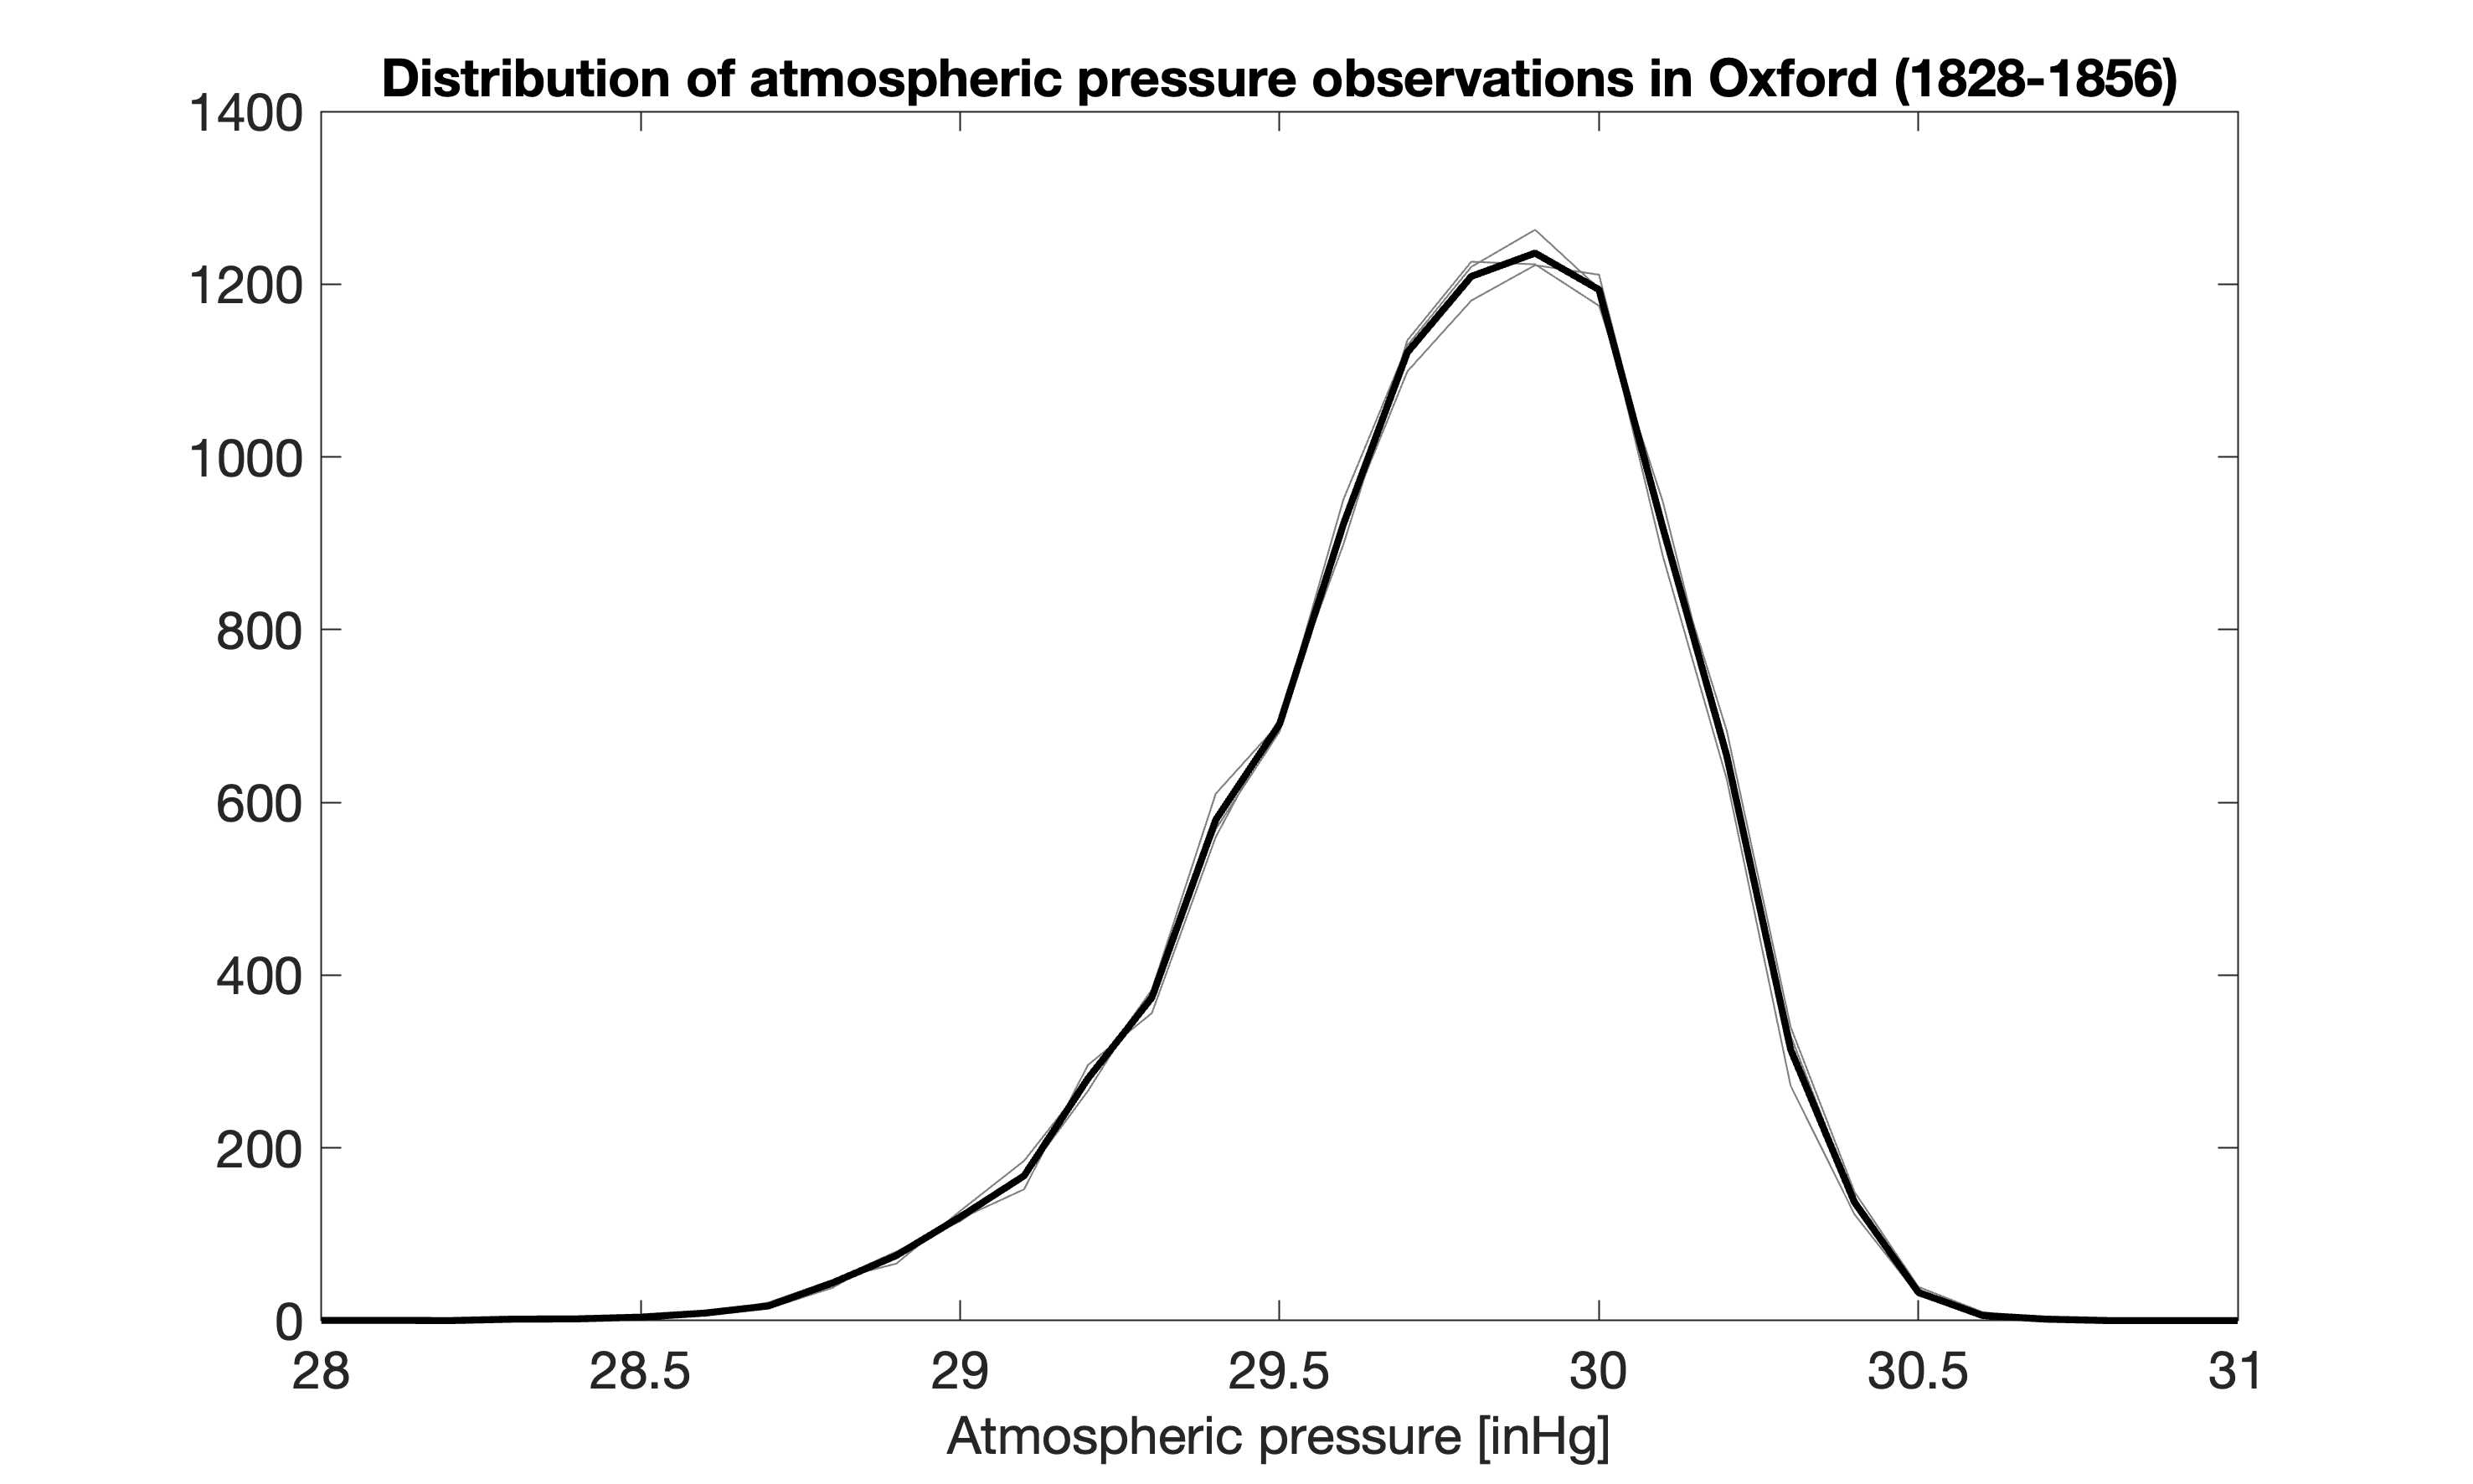
There is little variation between the distributions for the observations taken at different times of day (grey lines), with the black line representing the distribution for all the observations. It is very clearly a non-normal distribution which could have been calculated many years before Venn used the Cambridge data.
Of course, this calculation can be done in almost no time at all now, but would have taken Venn (or a contemporary) many days of rather tedious work.
I don’t expect there is a simple model that can reproduce that distribution, is there?