
Monitoring changes in UK temperature
Multiple sources of data agree on long-term observed trends
Those who want to downplay or dismiss the risks from climate change will often try to portray temperature observations as being corrupted and unreliable.
Recently the World Meteorological Organisation issued a statement about the quality of UK temperature monitoring, partly because the Met Office’s observational network had been the subject of disinformation spread online.
Scientifically, we can corroborate the reliability of national climate reconstructions by comparing the official Met Office UK temperature series - which shows a warming of about 1.5°C since 1884 - with alternative, independent estimates.
To (almost) no-one’s surprise, multiple sources of data agree on the long-term trends in UK temperatures.
First, we can use a reanalysis, specifically ERA5, or more specifically ERA5-land. You can download estimates of monthly average 2m air temperature, produced using a state-of-the-art weather forecasting system, back to 1950 on a global grid. And, if you restrict the data to just the UK and average it, you have an almost¹ independent estimate of UK air temperature change.
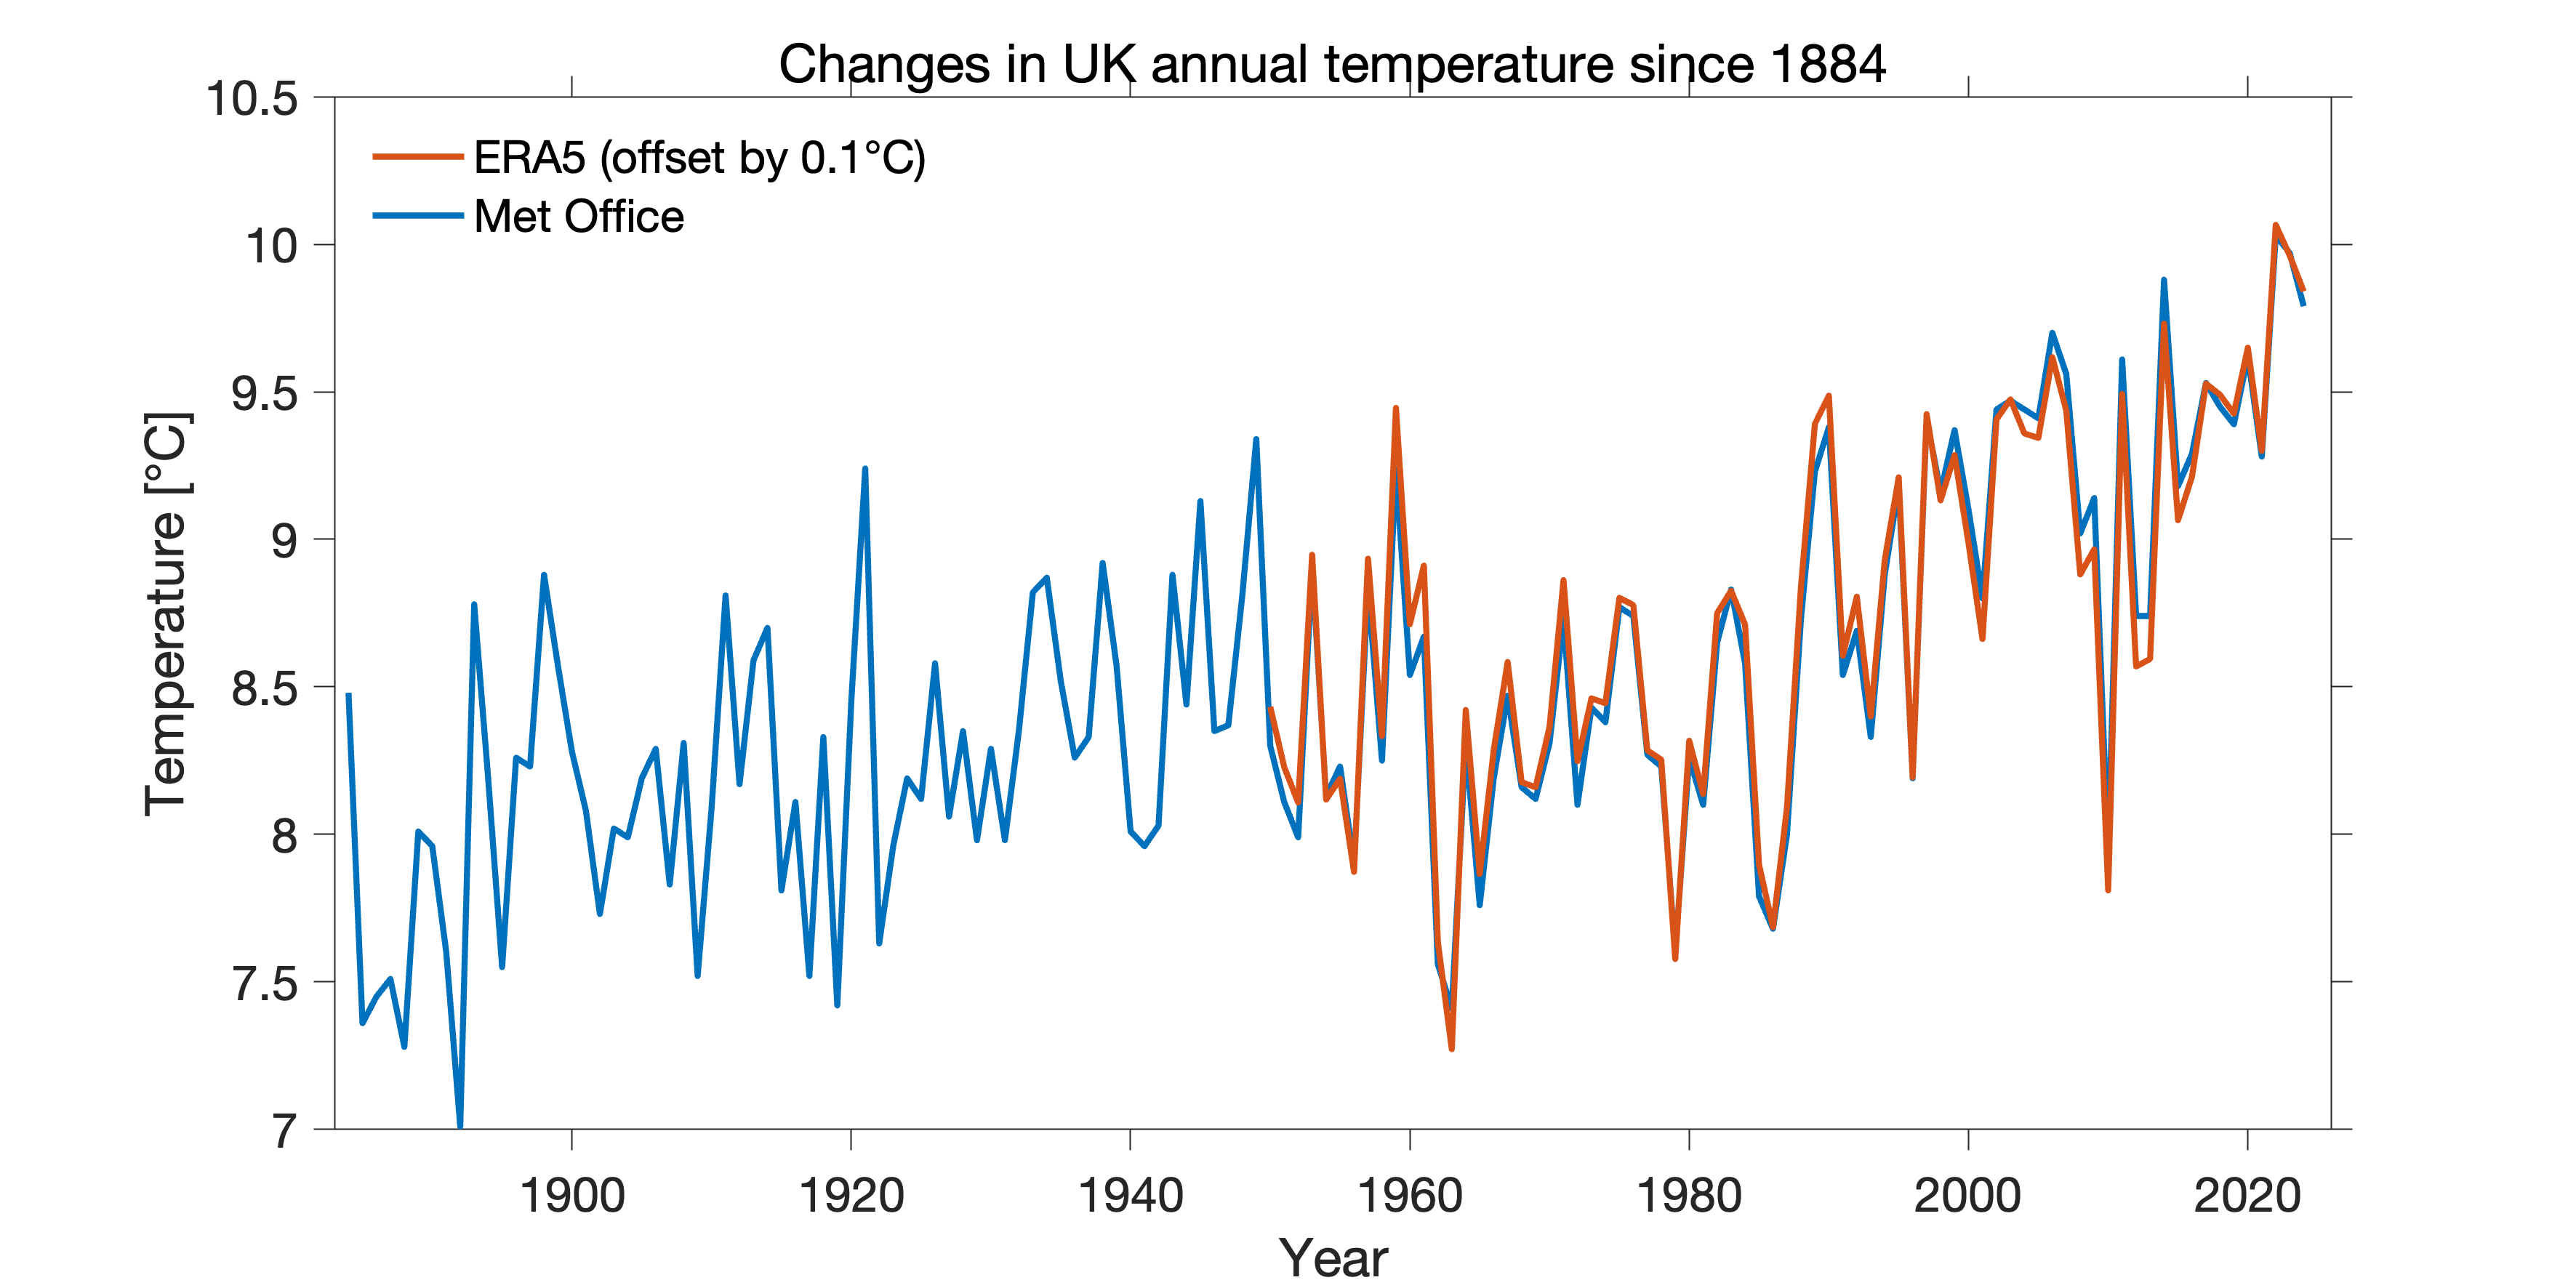
ERA5 agrees with the in-situ observations very well. So far, so good.
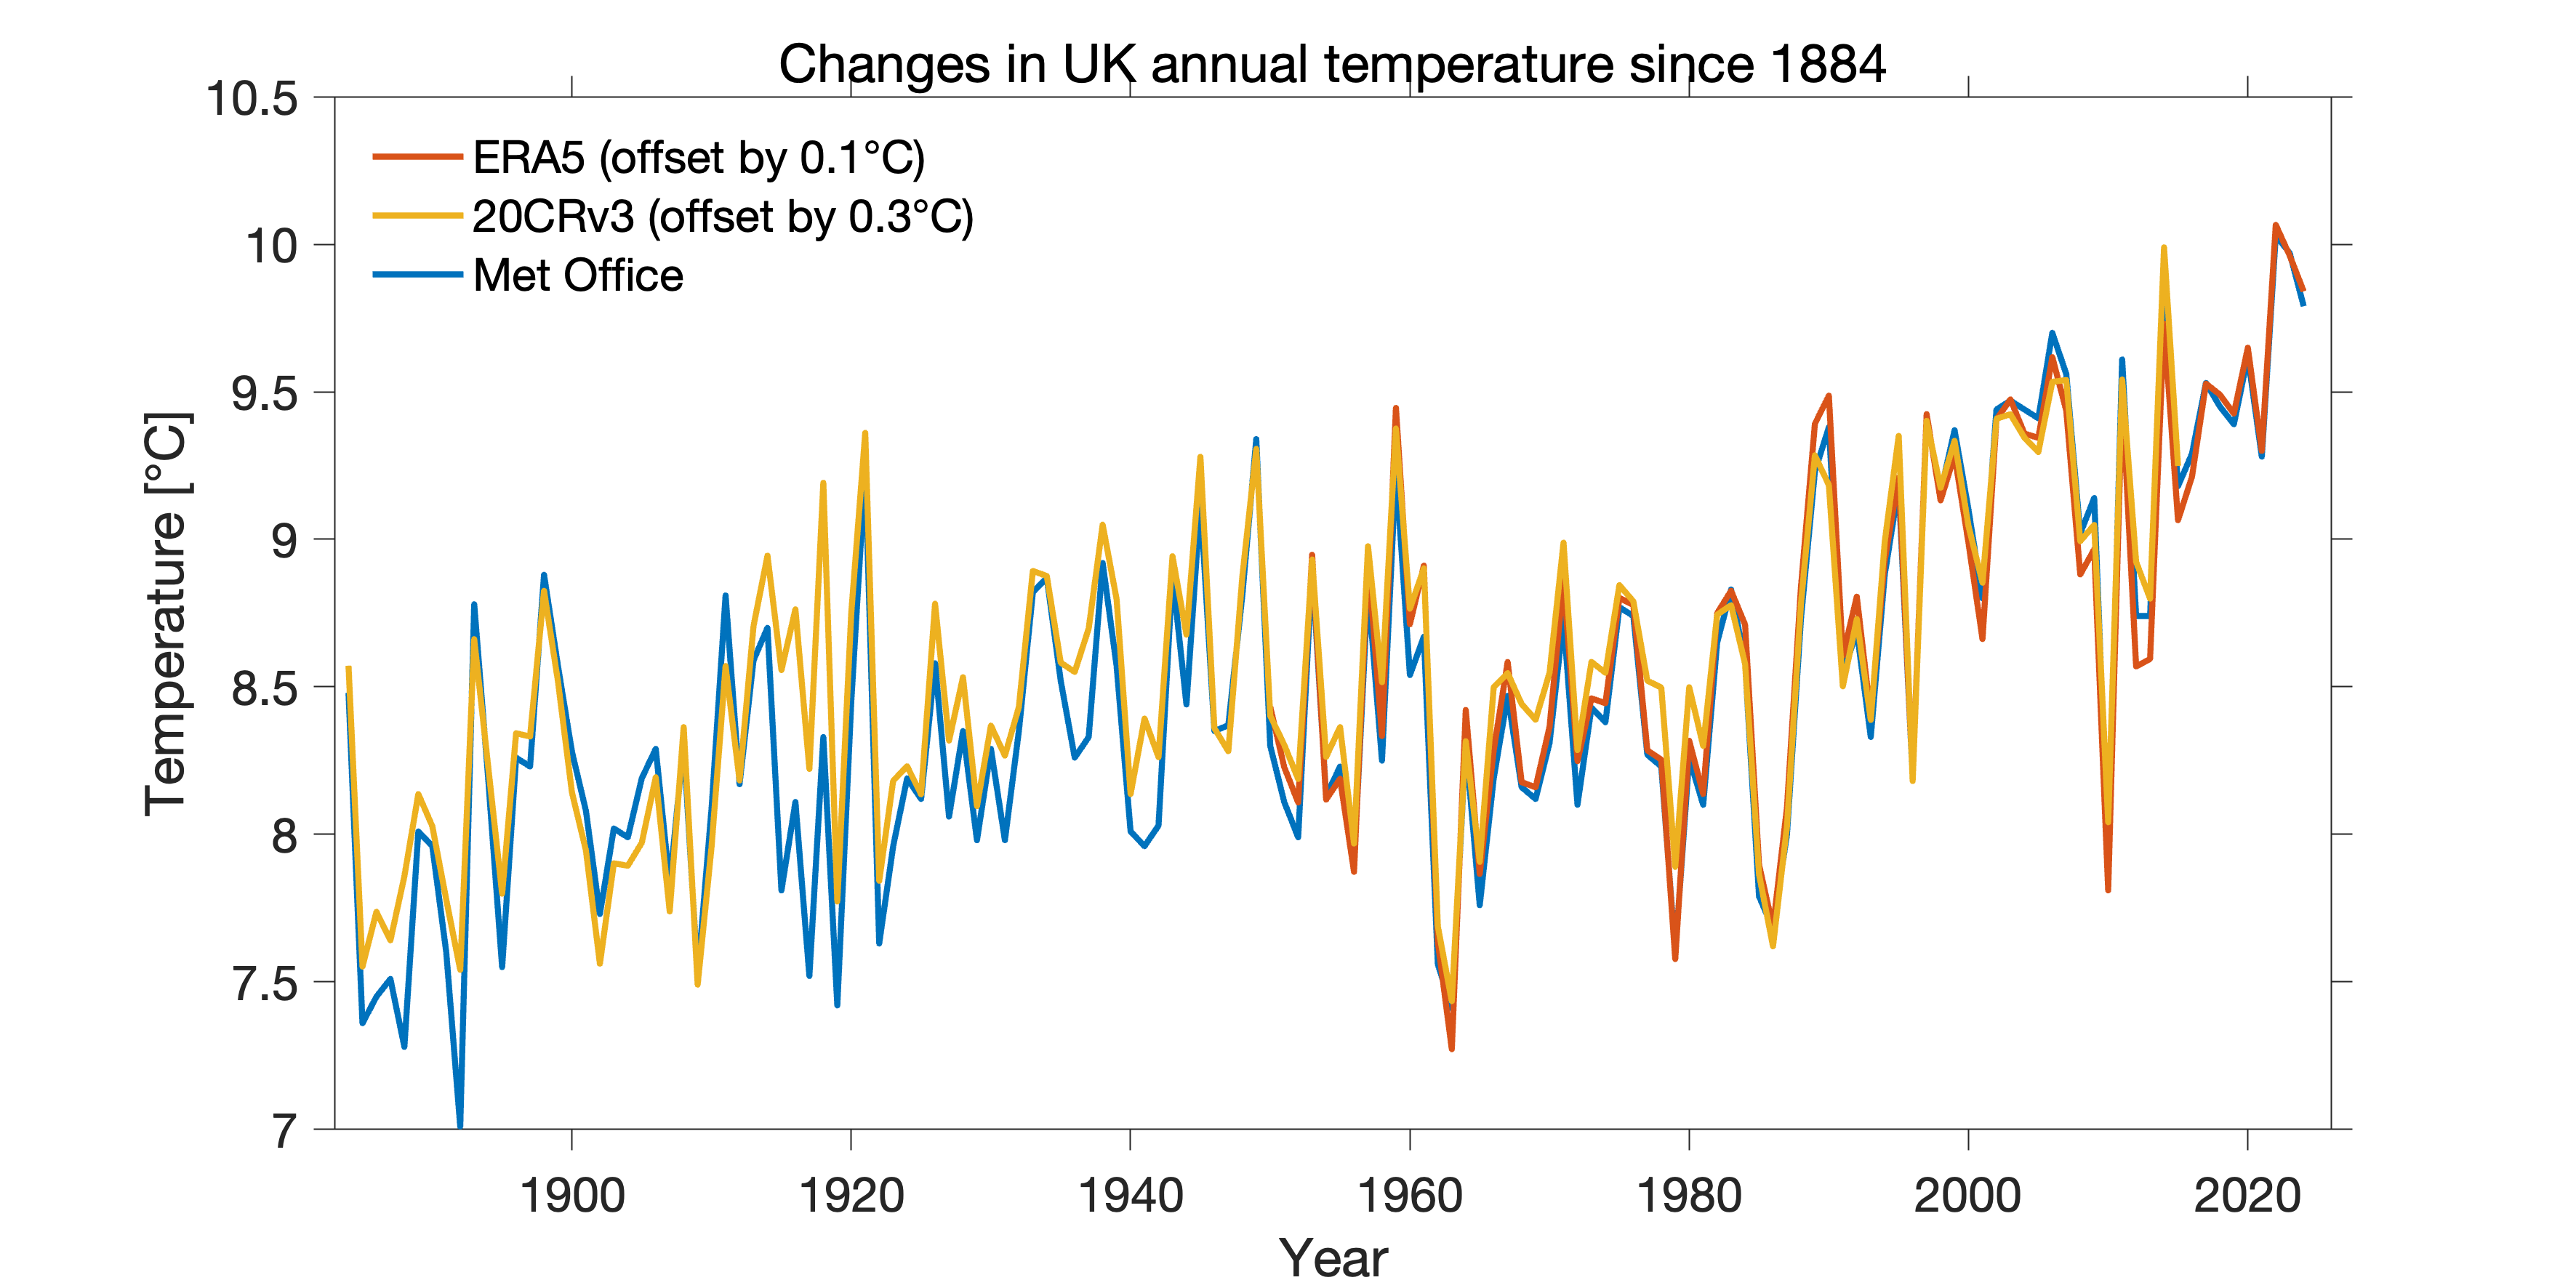
We can also add the 20th Century Reanalysis (v3) which goes back to 1884 (and earlier) but currently ends in 2015. This reanalysis system only assimilates (sometimes sparse) observations of pressure, and uses observed sea surface temperatures as boundary conditions. It uses none of the in situ temperature observations over land and is therefore fully independent of the Met Office series.
Even back to 1884, the trends and variations for UK temperature are very consistent². (There is some disagreement during World War I because some of the ship pressure observations fed into 20CRv3 around the UK have some issues at this time.)
Taking a different approach, we can also use measurements of soil temperature in the UK. Many weather stations have thermometers buried below ground at fixed depths, away from any disturbance at the surface. These observations are not often discussed or used to monitor climate trends, but perhaps they should be?
The UK has a soil temperature monitoring network with at least a hundred sites in operation at any one time since 1959. Although the Met Office does not produce an official estimate of UK average soil temperature, we can take the raw station data, average the available observations at each station (taken at 30cm/1 foot depth), and then average all the stations together to produce a simple UK annual average³.
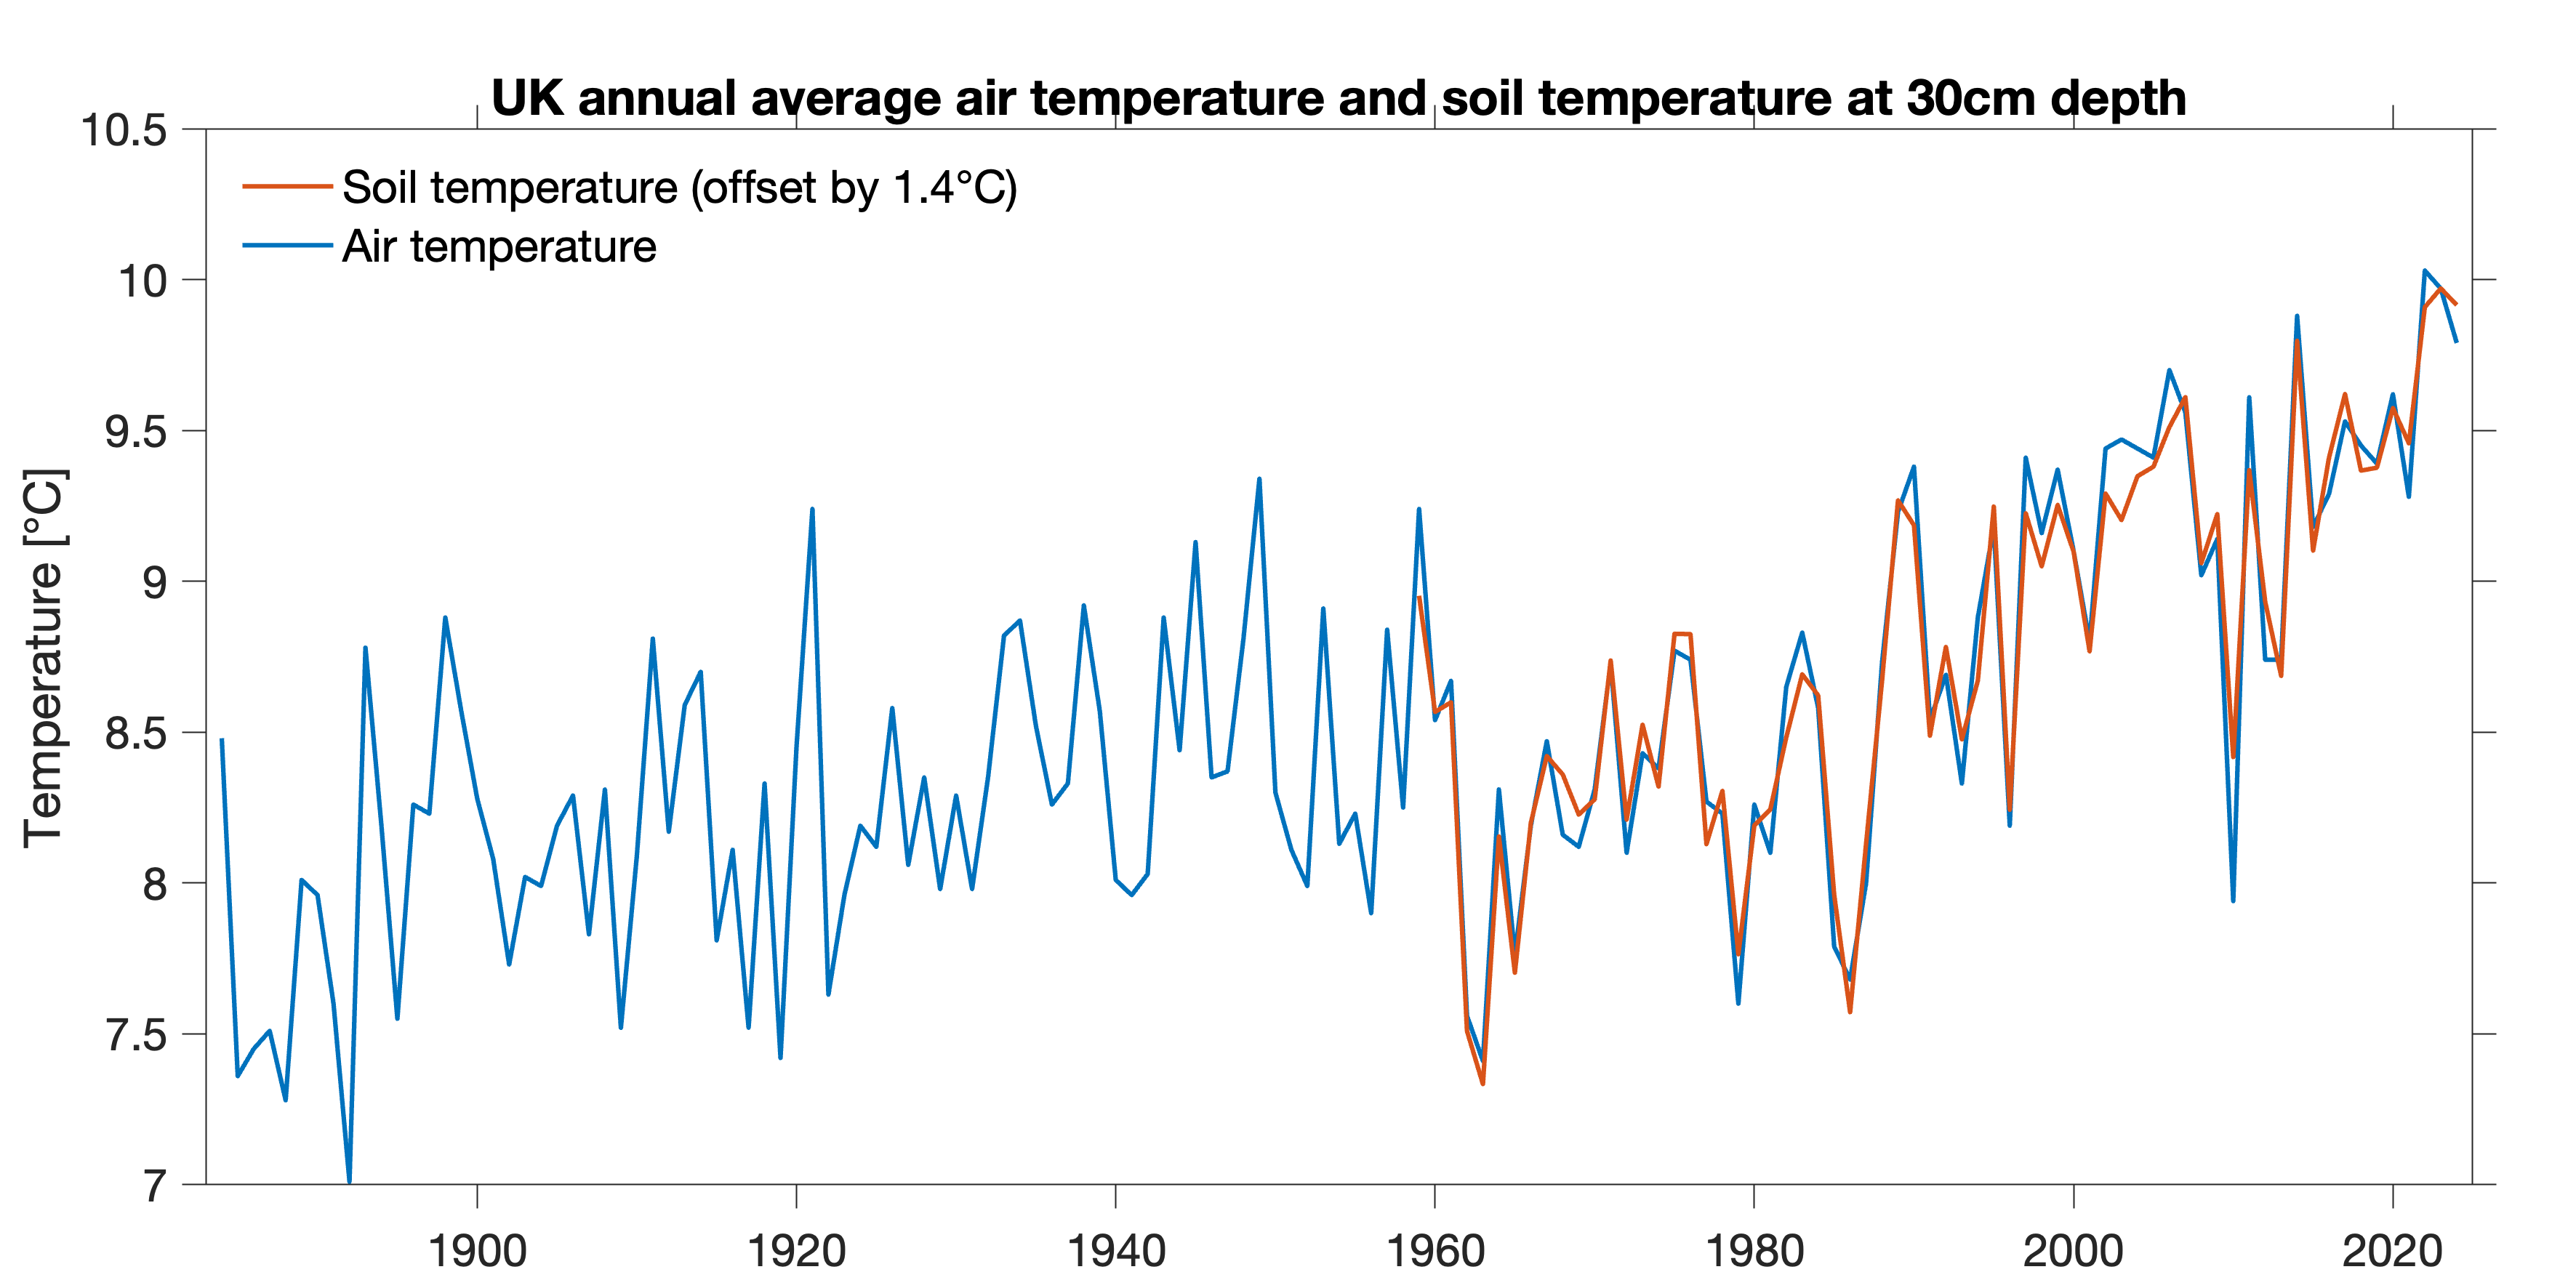
Lo and behold. The trends and the variations are again the same in this independent dataset. And, there is actually less inter-annual variance (by ~33%) in the soil temperature data so the trend is even more detectable. (There is an offset of about 1.4°C as soil temperatures are, on average, a bit warmer than air temperatures.)
There are far fewer soil temperature measurements currently available for the period before 1959, but it would be possible to extend this series further back with more work. For example, there are many paper records of monthly average soil temperature at 1 foot depth which could be digitised.
Last, changes in coastal sea surface temperatures around the UK also show very similar variations back to 1884, albeit with a slightly smaller trend, consistent with the expectation that ocean temperatures warm slower than land temperatures. This feature is observed worldwide.
In summary, the observed warming trends in UK air temperatures since the 1950s (and further back) are robust; several independent sources of data come to the same conclusion.
Footnotes:
¹ Some in situ temperature observations are assimilated into ERA5, but this is only one of many different sources. After the ~1970s they make up a very tiny fraction of the data used.
² The UK temperature from 20CRv3 was created using an online tool for a domain from 49.5N-61N and 8W-2E using land temperatures only. This includes small segments of Ireland and France and could be made more precise. Also, Harvey et al. highlighted that regional rainfall variations from 20CRv3 matched the UK rain gauge observations over 180 years.
³ The UK air temperature dataset is produced by interpolating temperature anomalies between available stations and then averaging across the whole UK. It would be better to do this for the soil temperatures as well (future project?) but this simple station average works well.
I firmly believe in the soundness of interpolation and adjustments, but for comparison the average raw temperature measurement should always be displayed too.
Because the interesting question is not "what was the temperature?" but "what is the change?". For this, the raw data would probably suffice.
I was actually having an argument regarding this a few days ago. Thank you for sharing!